Introduction
Mathematica 6.0 is so large and complicated that it will take a long time for it to be exploited to the full – and version 7.0 is already upon is! Fortunately, this is more of an evolutionary step in the devolpment of the product. The following setions merely highlight a few prettier features, whilst the great ocean of truth lays undiscovered before us.
Manipulate
Graphical manipulation
![]()
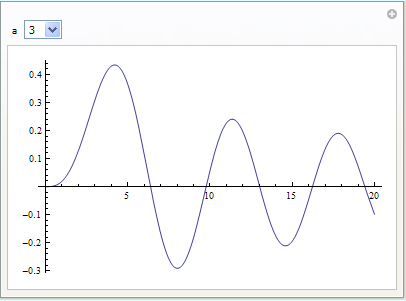
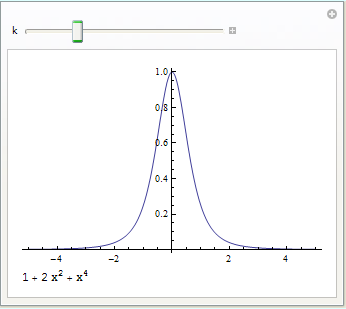
In effect Manipulate creates a lower level interface automatically that lets you explore the properties of your plot. This lower level is itself documented, but is somewhat less easy to exploit successfully. Here are a few more examples of such constructions (which are not limited to graphics):
Algebraic manipulation
![]()
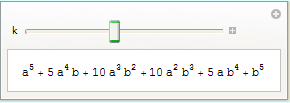
Mixed algebraic and graphical manipulate

Creating the Virtual Mathematica Book
The following code was supplied by Thomas Muench, and was first published by him in comp.soft-sys.math.mathematica . If you execute the following code, using Mathematica version 6.0, a new notebook will be created, containing a copy of the Mathematica book for 6.0! When it is finally done, click on the new notebook and save it.
Click the link in the top right hand corner to download the notebook corresponding to this page to try this code.
It may seem a little strange to run a notebook in order to create another notebook, but this program assembles the "Virtual Mathematica Book" using information that is already part of the help system of your Mathematica installation. The resultant notebook should be considered to be copyright WRI, and be used on the machine that contains Mathematica.
The corresponding physical book for the previous version of Mathematica – version 5.2 – was already very thick, so I would you to only print the notebook in sections.

Adding points to a graph with the mouse
The following code creates a graph that can be populated by clicking where you need a point. There is a guide at the bottom of the display to indicate exactly where the mouse is positioned, and you can display a small menu by performing a Shift-click. This enables you to remove a point.
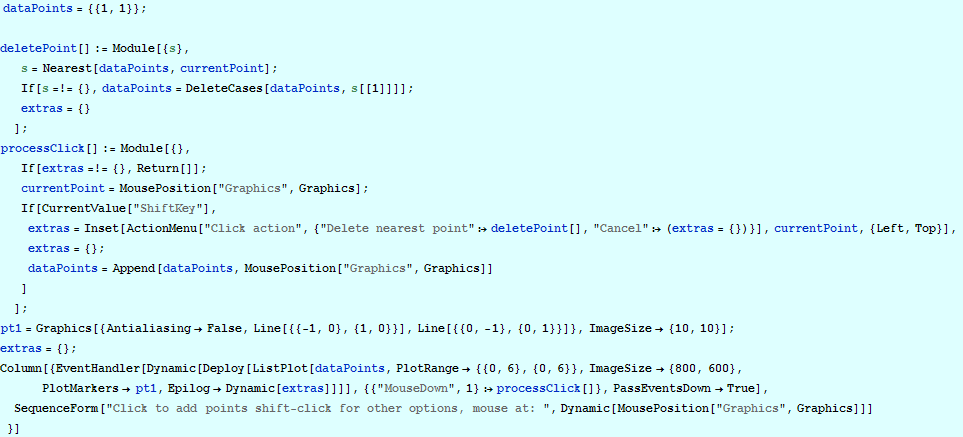
This code could be elaborated, but as with my SWP examples, I want to show something that can help jump – start your own development.I have also not wrapped this construction in a DynamicModule – again to keep it easy to read.
Notice in particular that the variable' extras' starts out as an empty list and is displayed dynamically, so that the menu control can be added and removed as required.
This example obviously bears a strong resemblance to example 1 for the Super Widget Package! In that example, I used right mouse clicks to activate a context menu.Although it is possible to trap the right mouse with Mathematica 6, I found that trapping Shift – click seemed more reliable.
General purpose graphic zoom palette
This is an example, kindly provided by Daniel Huber of Metohm Ltd. It creates a palette which can be used to zoom into any 2D graphics object in a notebook. Run the code to create the palette, then select any graphics object by clicking on it, and press the zoom button to view an enlarged version in a separate (temporary) notebook. This example uses the fact that graphics objects in 6.0 have the same structure in the FrontEnd as they do in the kernel – and can thus be picked out of a notebook and manipulated further. For this reason, you cannot expand graphics created with Mathematica version 5.2 or earlier.
You will see the graphics displayed twice in the temporary notebook. Use the two locators in the top graphic to selected the rectangular zoom region to be displayed in the second window. Note that the temporary notebook can be stretched or maximised as desired.
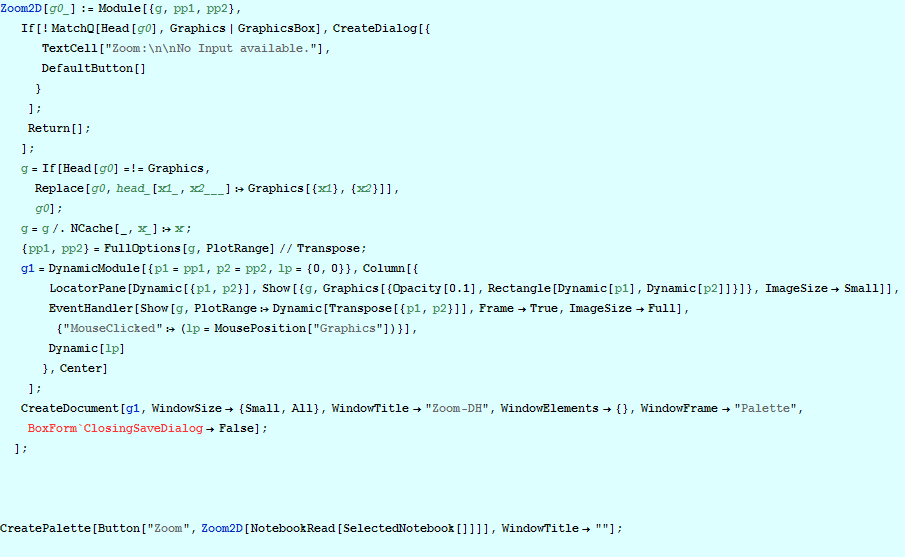
It is important to realise that the graph is not re-creted each time it is zoomed, so for example, you may end up with too few sample points on a graph created using Plot. Note that because Mathematica adds axes to a plot automatically, the axes on the zoomed plot do reflect the zoomed ranges.


